Exposure-Adjusted Incidence Rate Calculator
Exposure-Adjusted Incidence Rate (EAIR) measures events per 100 patient-years.
Example: If 10 patients each took a drug for 2 years (20 patient-years total), and 5 had an event, the EAIR is 25 per 100 patient-years.
The IR would be 50% (5 patients out of 10), which doesn't account for treatment duration.
Incidence Rate (IR)
IR = [Calculated value]
Exposure-Adjusted Incidence Rate (EAIR)
EAIR = [Calculated value]
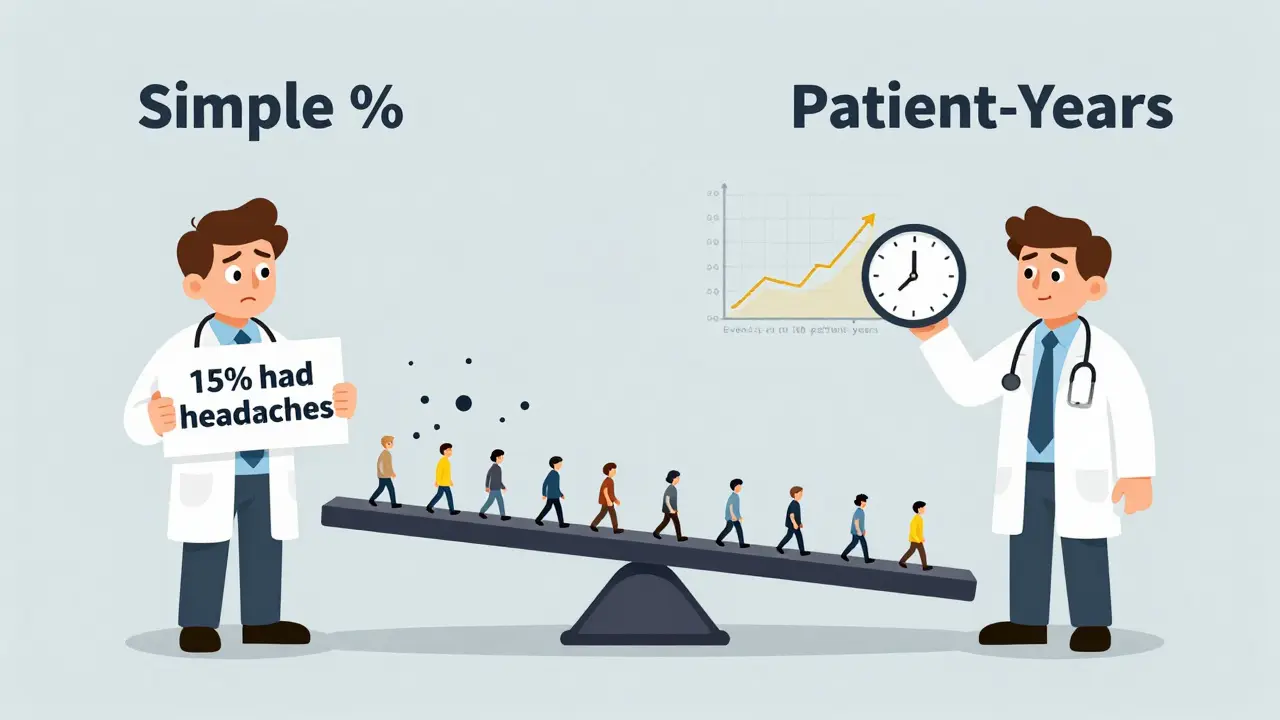
When you hear that 15% of patients in a drug trial had a headache, it sounds simple. But is that number really telling you how risky the drug is? Not if you don’t know how long those patients were taking it. That’s where adverse event rates get complicated - and why the FDA is pushing for smarter ways to measure them.
Why Simple Percentages Don’t Tell the Whole Story
For years, the go-to way to report side effects in clinical trials was the Incidence Rate (IR): just divide the number of people who had an adverse event by the total number of people in the study. If 30 out of 200 patients got nausea, you say, "15% experienced nausea." Easy. But here’s the problem: what if one group took the drug for 3 months and another took it for 2 years? The group with longer exposure will naturally have more events - not because the drug is more dangerous, but because they were exposed longer. Using raw percentages hides that difference. A 2010 analysis by Andrade found this method underestimates true event rates by 18% to 37% in trials with uneven treatment durations. Imagine two diabetes drugs. One requires daily pills for life. The other is only used for 6 months. If 10% of patients on the long-term drug get liver enzyme changes, but only 8% on the short-term drug do, is the first drug really worse? Not if you don’t account for exposure time. That’s why regulators are moving away from this outdated approach.The Shift to Exposure-Adjusted Metrics
In 2023, the FDA requested that a biologics company submit data using Exposure-Adjusted Incidence Rate (EAIR) instead of traditional IR. It was a quiet but powerful signal: the agency no longer accepts simplistic percentages for serious safety assessments. EAIR counts how many events happen per 100 patient-years. A patient-year means one person taking the drug for one full year. If 10 patients each took the drug for 2 years, that’s 20 patient-years. If 5 of them had a rash, the EAIR is 25 events per 100 patient-years (5 ÷ 20 × 100). This method doesn’t just count people - it counts time. That’s critical for chronic conditions. A drug for rheumatoid arthritis might cause joint pain in 12% of patients over 6 months. But over 5 years, that same 12% could become 45% - not because the drug got worse, but because people were exposed longer. EAIR captures that trend accurately.How EIR Fits In - And Where It Falls Short
Another method, Event Incidence Rate (EIR), also uses patient-years but focuses on total events, not unique patients. So if one person gets three headaches in a year, EIR counts three events. That’s useful for recurrent issues like migraines or diarrhea. But it can inflate risk. If 5 people each get 4 episodes of vomiting over a year, EIR says there are 20 events. IR says 5 people were affected. Which tells you more about safety? It depends on the question. EIR is great for understanding how often side effects occur. But if your goal is to know how many people are at risk, IR still has value. The key is knowing which metric answers which question. The FDA doesn’t demand one method - it demands justification. If you use IR, you must explain why it’s appropriate for your study.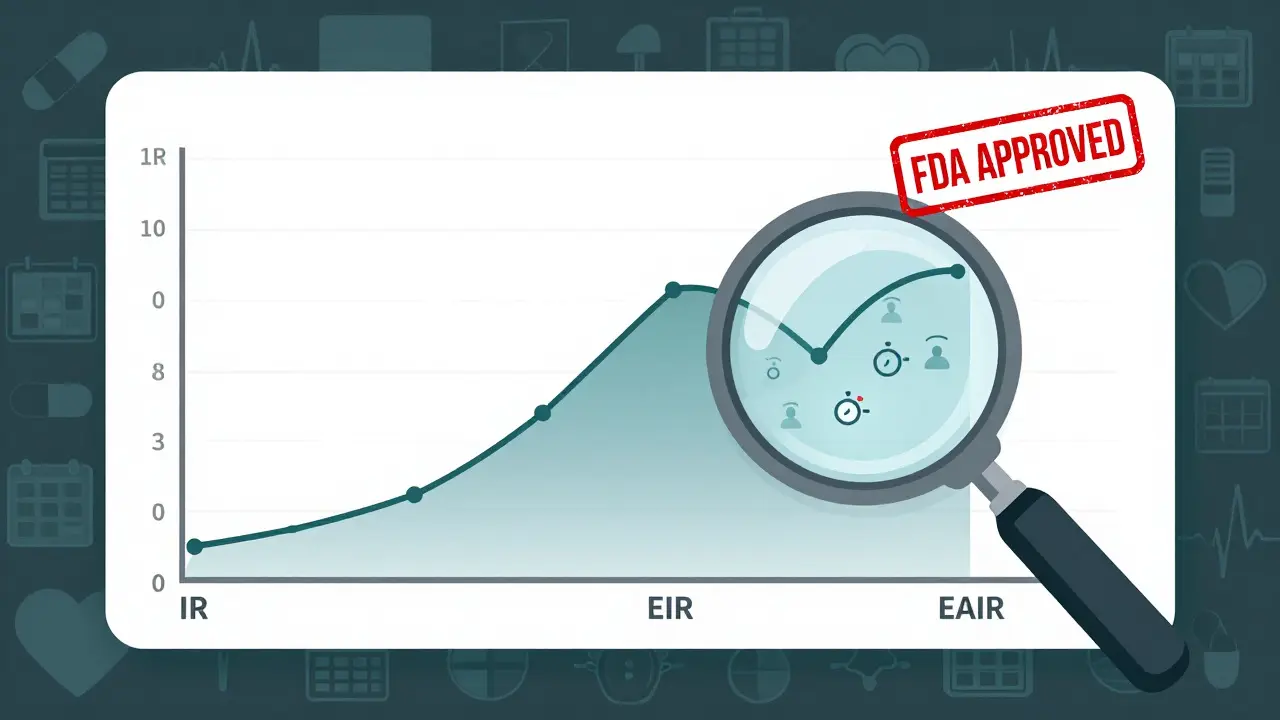
Relative Risk and Why Confidence Intervals Matter
Comparing two drugs? You don’t just look at their individual rates. You calculate the Incidence Rate Ratio (IRR) - the ratio of one group’s rate to the other’s. If Drug A has an EAIR of 30 per 100 patient-years and Drug B has 15, the IRR is 2.0. That means Drug A has twice the rate of the event. But is that difference real? Or just random noise? That’s where confidence intervals come in. Statisticians use the Wald method to calculate these for IRR. If the 95% confidence interval for that 2.0 IRR runs from 1.1 to 3.8, you can say with confidence that Drug A is genuinely riskier. If the interval crosses 1.0 - meaning it could be 1.0 or lower - then you can’t rule out chance. The Wilson score method is often used for IR and EIR confidence intervals. These aren’t just math exercises. They’re the difference between making a life-changing decision based on solid evidence - or a misleading number.Competing Risks and Why Kaplan-Meier Fails Here
What happens when a patient dies before you can see if they’d develop a liver injury? That’s a competing risk. Traditional methods like the Kaplan-Meier estimator assume everyone stays at risk until the end of the study. But in reality, death removes someone from the pool of people who could have an adverse event. A 2025 study in Frontiers in Applied Mathematics and Statistics showed that using Kaplan-Meier in these cases leads to biased results - sometimes overestimating risk by 20% or more. The better approach? Cumulative hazard ratio estimation. It breaks down risk into separate components: death, and the adverse event you’re tracking. This gives a clearer picture of what’s actually happening. For drugs treating advanced cancer or heart failure, this isn’t academic. It’s essential. If you misrepresent the safety profile, you could scare doctors away from a life-extending treatment - or worse, let a dangerous drug slip through.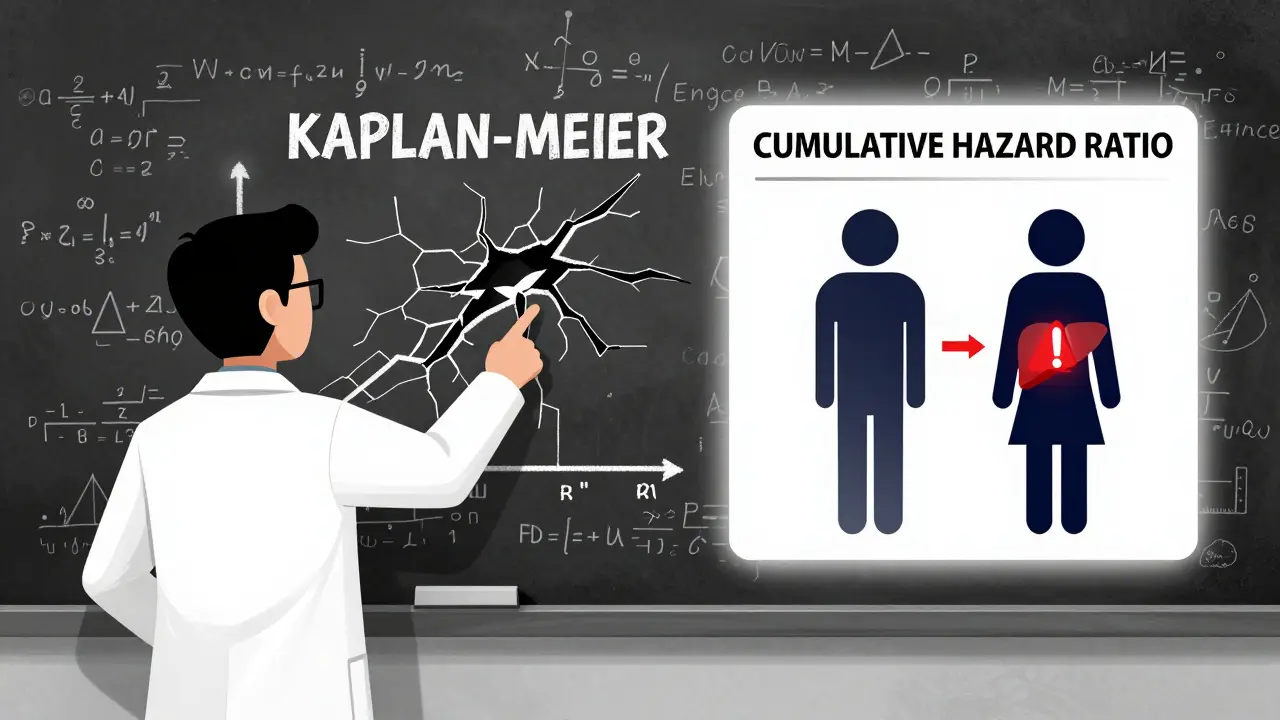
What This Means for Real-World Trials
Companies are catching on. In 2023, 47% of FDA submissions included exposure-adjusted metrics - up from just 12% in 2020. Drug makers are investing in new software, training teams, and rewriting analysis pipelines. MSD found that switching to EAIR uncovered previously hidden safety signals in 12% of their chronic disease programs. Roche, on the other hand, had to train medical reviewers because 35% initially misunderstood EAIR results. SAS and R programmers now have standardized macros to calculate EAIR. The PhUSE GitHub repository for these tools has been downloaded over 1,800 times. But it’s not easy. One programmer said EAIR took 3.2 times longer to code than IR. Common mistakes? Wrong start/end dates, ignoring treatment breaks, miscalculating patient-years. CDISC, the global standard for clinical data, now requires both IR and EAIR for serious adverse events in oncology trials. The FDA’s Biostatistics Review Template includes checklists to make sure companies are doing it right.What You Need to Know - Even If You’re Not a Statistician
You don’t need to write SAS code to understand this. But you do need to ask the right questions when reading clinical trial results:- Is the adverse event rate reported as a simple percentage - or adjusted for time?
- How long did patients actually take the drug?
- Were the treatment groups exposed for similar durations?
- Is there a confidence interval? Does it include 1.0?
- Are competing risks (like death) accounted for?
The Future Is Exposure-Adjusted
By 2027, experts predict 92% of Phase 3 drug submissions will include EAIR alongside traditional IR. The FDA’s 2024 draft guidance is pushing for standardization. Machine learning tools are being trained to detect safety signals using these metrics - and they’re already 38% better at catching early warnings than old-school methods. This isn’t about making statistics harder. It’s about making safety clearer. A drug might have a higher percentage of side effects - but if those side effects only happen in the first week, and patients stop taking it, the real risk is low. Another drug might have a lower percentage - but if patients stay on it for years, those same side effects could become life-altering. The goal isn’t to scare people away from new medicines. It’s to make sure we understand exactly what we’re getting into. And that starts with asking: adjusted for what?What’s the difference between IR and EAIR in clinical trials?
Incidence Rate (IR) is the percentage of patients who had an adverse event, regardless of how long they were on the drug. Exposure-Adjusted Incidence Rate (EAIR) measures events per 100 patient-years - meaning it accounts for how long each patient was exposed. EAIR gives a more accurate picture of risk when treatment durations vary between groups.
Why did the FDA start asking for EAIR in 2023?
The FDA requested EAIR because traditional IR methods can mislead. In trials where patients stay on a drug for years - like for chronic conditions - raw percentages hide how exposure time affects side effect frequency. EAIR reveals true safety patterns, helping regulators make better decisions about drug approval and labeling.
Is EIR better than EAIR for all types of side effects?
No. EIR counts total events, not unique patients. That’s useful for recurring issues like nausea or diarrhea, but it can overstate risk if one person has multiple events. EAIR is better for understanding how many people are affected over time. The choice depends on the clinical question: frequency of events (EIR) vs. risk per exposed person (EAIR).
Can a drug have a high IR but low actual risk?
Yes. If a drug causes mild side effects like headaches in 20% of patients, but those patients stop taking it after 2 weeks, the real risk is low. A high IR without exposure context makes the drug look riskier than it is. EAIR would show the rate drops sharply once exposure time is factored in.
What are competing risks, and why do they matter?
Competing risks occur when one event (like death) prevents another (like liver injury) from being observed. Traditional methods like Kaplan-Meier assume everyone stays at risk - but that’s not true. If a patient dies before developing a side effect, they’re no longer at risk for it. Ignoring this distorts safety data. Cumulative hazard ratio estimation fixes this by modeling death and adverse events separately.
Should I trust a clinical trial that only reports simple percentages?
Be cautious. If a trial only gives you a simple percentage without exposure time, it’s incomplete. Ask: How long were patients on the drug? Were groups compared fairly? If those answers aren’t there, the safety data may be misleading. Look for EAIR or EIR - or at least a clear explanation of why IR was used.
Gregory Parschauer
January 15, 2026 AT 07:34Let me just say this: if your clinical trial is still using raw incidence rates in 2025, you’re not just outdated-you’re dangerous. The FDA’s move to EAIR isn’t bureaucratic fluff, it’s a lifeline for patients. I’ve seen trials where a drug looked ‘safe’ because they only tracked 3 months, but 80% of the serious events happened after year two. That’s not science, that’s negligence dressed up as statistics. Stop pretending percentage is precision. It’s not. It’s a lie with a p-value.
John Tran
January 17, 2026 AT 01:06you kno wtf is wild? like… we’ve been doing this wrong for DECADES and nobody cared until the FDA got a spreadsheet and a caffeine habit. like, imagine if your doctor told you ‘15% of people get headaches’ and didn’t tell you they were on the drug for 3 days or 3 years? you’d be like ‘oh cool’ and then wake up 5 years later with liver failure thinking ‘wait, i thought this was safe??’
the real tragedy? most med students still learn IR in med school. they’re being trained on 1998 tech. we’re using quantum algorithms to predict weather but still measuring drug risk with a ruler from the 80s. it’s like using a flip phone to navigate a self-driving car. the tech is there, but the culture? still stuck in dial-up.
and don’t even get me started on confidence intervals. half the papers i read don’t even report them. just ‘p<0.05’ and boom, new miracle drug. bro. no. just… no.
mike swinchoski
January 17, 2026 AT 17:37This is why people don’t trust science. You guys turn a simple question-‘how many people got sick?’-into a 10-page math essay. If 15% got headaches, that’s 15%. Why do we need patient-years? Just tell me if I’ll get a headache. That’s all I care about.
Also, if the drug helps me live longer, who cares if I get a headache? Stop overcomplicating everything. People aren’t statisticians. We’re patients.
Trevor Whipple
January 18, 2026 AT 23:51lol i just read this whole thing and my brain hurt. like, EAIR? EIR? IR? wtf is the difference? i thought we were talking about drugs, not a math competition. but okay, fine. i’ll play along.
so if i take a drug for 6 months and 10% get nausea, and someone else takes it for 5 years and 12% get it, the ‘real’ risk is… what? 12%? but wait, the person with 5 years had 5x more exposure, so is it 60%? no? then why are we even doing this? why not just say ‘here’s the risk after 6 months, here’s the risk after 5 years’? why invent new acronyms? it’s like making a new word for ‘car’ because you think ‘automobile’ is too basic.
also, who the hell codes EAIR in SAS? that’s 3x longer? i’d rather just guess.
Lethabo Phalafala
January 19, 2026 AT 15:55I work in rural clinics in South Africa. We don’t have SAS. We don’t have PhD statisticians. We have nurses, a tablet, and a hope. When a patient comes back with a rash after 18 months on a drug, and the trial said ‘only 8% had rashes,’ I’m supposed to believe them? No. Not anymore.
That 8%? It was probably calculated on people who stopped after 3 months. My patient didn’t stop. She survived. She’s here. And now she’s got a rash, fatigue, and no money for a specialist.
This isn’t academic. This is someone’s mother. Someone’s sister. Someone’s child. If your metric doesn’t reflect real life, it’s not science-it’s silence.
sam abas
January 19, 2026 AT 22:24okay but… what if the FDA just wants to make drug approvals harder? like… this whole EAIR thing feels like a bureaucratic landmine. companies spend millions on it, then get rejected anyway because ‘the confidence interval crossed 1.0.’ but what if the drug saves lives? what if the side effects are mild? what if the patient population is old and dying anyway?
maybe we’re solving a problem that doesn’t exist. maybe the ‘bias’ in Kaplan-Meier is just… reality. people die. maybe the ‘risk’ isn’t the drug, it’s aging.
also typo: ‘incidnece’ in the post. i’m not even mad. i’m just… disappointed.
vishnu priyanka
January 20, 2026 AT 01:49in India, we call this ‘chalta hai’ culture - ‘it’ll do.’ We’ve been giving drugs to people for decades without patient-years. If it helps, we use it. If they get a headache, they take paracetamol. If they get liver issues, we switch.
But honestly? This EAIR stuff? It’s beautiful. Like a raga - complex, layered, but if you listen right, it tells the whole story. The drug doesn’t just ‘cause’ side effects. It sings them over time. And we need to hear the whole song, not just the first note.
Also, 1,800 downloads on PhUSE? That’s more than the number of people who actually read the FDA guidelines. Progress, but slow. 🌿
Angel Tiestos lopez
January 21, 2026 AT 16:14so like… imagine you’re on a road trip. IR is like saying ‘15% of drivers got a flat tire.’ EAIR is saying ‘15% got a flat per 1,000 miles.’
one tells you how many people had problems. the other tells you how risky the drive actually was.
and if you’re driving across the desert for 2 weeks? you’re gonna get more flats. not because your car is junk. because you drove farther.
the FDA isn’t making things harder. they’re just asking you to stop lying to yourself. 🚗💨